
The True Cost of a Bad Hire: A Framework for Hiring ROI

Your finance team can tell you, down to the dollar, what you spent on last quarter's hiring. They'll show you recruiter fees (20-30% of salary), job board costs, interview time, and relocation expenses. For a $75,000 position, the accounting is straightforward: perhaps $20,000 in direct costs, maybe $25,000 if the search was difficult.
This accounting is worse than incomplete. It's dangerously misleading.
The actual cost of that bad hire, the one who seemed perfect in interviews but never quite delivered, who stayed eighteen months before being managed out, wasn't $25,000. It was somewhere between $225,000 and $300,000. Your finance team didn't capture this cost because most of it never touched the hiring budget. It bled out through a dozen other line items, none of which got traced back to the hiring decision that caused them.
This isn't conjecture. It's arithmetic. And once you understand the mathematics of hiring failure, you can't look at your hiring process the same way again.
The Direct Costs: What Your Finance Team Actually Tracks
Start with what does get measured. For our $75,000 position, direct costs typically include:
Recruiting and onboarding: $15,000-$22,500 (20-30% of salary for external recruiter, or $8,000-$12,000 for internal recruiting costs, plus $3,000-$5,000 in onboarding)
Training and development: $5,000-$8,000 (formal training, certifications, informal coaching time from senior staff)
Salary and benefits during unproductive period: $37,500-$56,250 (6-9 months at reduced productivity, effectively paying full salary for partial output)
Separation costs: $3,000-$8,000 (severance, unemployment insurance increase, exit processing, legal review if contested)
Total direct costs: $60,500-$94,750
This is already larger than most CFOs estimate. But it's still only one-third of the story.
The Productivity Ramp: The Cost of Negative Output
Here's where conventional accounting breaks down. Companies track salary as a cost. They rarely track productivity as a return. This asymmetry creates blind spots.
A new hire doesn't produce zero value during their ramp period. They produce negative value. They consume time from productive employees, they make mistakes that require correction, they slow down processes they don't understand. The team isn't just missing their productivity; it's paying for their learning curve.
The mathematics:
Months 1-3: New hire operates at -20% to +20% productivity (taking more time than they save). Cost to organization: $18,750-$22,500 in salary, plus $15,000-$25,000 in lost productivity from team members doing training, correction, and cleanup.
Months 4-6: Marginal productivity reaches 50-60%. They're producing some value, but still consuming disproportionate management attention. Opportunity cost: $8,000-$12,000 (manager spending 25% of time on this hire instead of strategic work).
Months 7-12: This is where good hires reach 85-100% productivity. Bad hires plateau at 60-70% and stay there. Productivity gap: $15,000-$22,500 annually.
If you identify the problem at month 12 and begin managing out the employee, you're looking at another 6 months of deteriorating performance while you document issues, go through HR processes, and search for a replacement. During this period, productivity often drops to 40-50% as the employee disengages.
Total productivity loss: $56,750-$82,000
Team Disruption: The Multiplier Effect
Bad hires don't just underperform in isolation. They create drag on everyone around them.
Your high performers pick up the slack. That senior analyst who should be building forecasting models spends three hours per week checking the new hire's work. Your engineering lead codes around the problematic hire's components instead of architecting new systems. Your sales manager personally closes deals the new rep should handle.
This isn't temporary accommodation during a learning curve. This becomes permanent organizational inefficiency.
Quantify it:
Team time diversion: 3-5 team members spending 5-10% of their time compensating for underperformance. At an average loaded cost of $100,000 per employee, that's $15,000-$50,000 annually in misdirected labor.
Morale impact: Harder to measure, but Harvard Business Review research suggests team productivity drops 3-7% when a member is perceived as not pulling their weight. For a team of 8 with average total compensation of $100,000, that's $24,000-$56,000 in lost output.
Meeting tax: Bad hires generate more meetings - clarification meetings, correction meetings, status update meetings. If this hire adds just one extra hour of meetings per week for 6 team members, that's $15,600 annually (6 people × 52 hours × $50 blended rate).
Total team disruption cost: $54,600-$121,600
The Opportunity Cost of Vacancy: Revenue You Never Captured
While you're managing out the bad hire and searching for their replacement, the position sits functionally vacant. This matters most for revenue-generating roles, but it has implications across all functions.
For a $75,000 sales role: If quota is $750,000 annually and margin is 30%, every month of vacancy costs you $18,750 in gross profit. A 6-month gap between identifying the problem and having a new hire productive costs $112,500.
For a $75,000 finance role: If this person was supposed to implement a spend analytics system that would generate $200,000 in annual savings, every quarter of delay costs you $50,000.
For a $75,000 operations role: If this position was created to reduce overtime costs, and overtime continues at $40,000 per quarter while the position is vacant, you're bleeding cash.
The opportunity cost calculation requires asking: "Why did we create this position?" Whatever business case justified the headcount continues to accrue costs until the position is properly filled.
Opportunity cost range: $37,500-$112,500 (depending on role type and organizational impact)
The Cascade Effect: How One Bad Hire Breaks Other Employees
The most insidious cost is what happens to your good employees while they're compensating for your bad hire.
Your top performers burn out. That senior accountant who's been covering for the new hire's mistakes? She starts looking at job postings at month 8. She leaves at month 14. Now you're not just replacing the bad hire, you're replacing the good employee who broke from covering for them.
The numbers:
Turnover acceleration: Research from Leadership IQ shows that 46% of new hires fail within 18 months, but also that employees who work closely with underperformers are 54% more likely to leave. If your bad hire causes one additional departure, that's another full hiring cycle: $60,000-$95,000 in costs.
Burnout degradation: The employees who stay often work at reduced capacity. If two team members are operating at 85% effectiveness instead of 100% due to increased workload and frustration, that's $15,000-$30,000 in lost productivity.
Cultural damage: Bad hiring decisions that aren't corrected quickly signal to high performers that mediocrity is tolerated. This is nearly impossible to quantify, but it's real. Your next hiring cycle becomes harder because word gets out.
Cascade effect total: $75,000-$125,000
The Complete Accounting
Add it up:
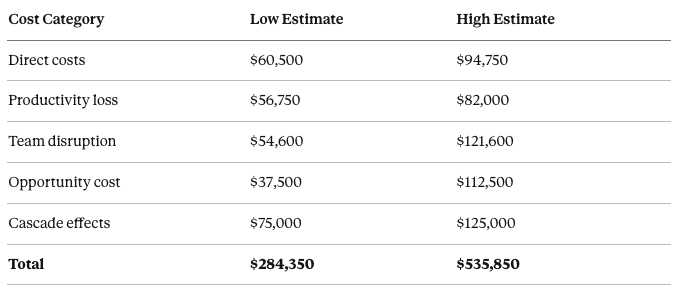
For a $75,000 position, the true cost of a bad hire runs 3.8 to 7.1 times the annual salary.
Even using the conservative end of the range, you're looking at $284,000, not the $25,000 your finance team tracked.
Building an ROI Framework for Hiring Decisions
Once you understand the real cost of failure, the ROI calculation for hiring quality becomes straightforward.
The speed trap:
Most companies optimize hiring for time-to-fill. Every day a position sits vacant feels expensive, so pressure builds to "just make a decision." But the math shows that a bad hire costs 10-15x more than an extra month of vacancy.
If extending your search by 4 weeks increases your odds of a good hire from 60% to 80%, you reduce your expected failure costs from $113,740 (40% × $284,350) to $56,870 (20% × $284,350). You just saved $56,870 by spending an extra month searching. Even if the vacancy costs you $10,000 in lost productivity, you're ahead by $46,870.
The quality premium:
Some companies balk at recruiter fees. "Why pay 25% when we can hire for 20%?" Because the 5% premium on a $75,000 salary is $3,750, and if it reduces your failure rate by even 5 percentage points, the expected value is:
Cost of premium: $3,750
Reduction in expected failure cost: 5% × $284,350 = $14,218
Net benefit: $10,468
You should pay the premium. Every time.
The assessment investment:
Structured interviews, work sample tests, personality assessments, reference checks - each adds cost and time. But if a $2,000 assessment process improves hiring success by 10 percentage points, the ROI is:
Cost: $2,000
Expected benefit: 10% × $284,350 = $28,435
Net benefit: $26,435
The ROI is 1,322%.
What This Means for Your Hiring Process
Three implications:
First, speed is overvalued.
Your current process optimizes for the wrong variable. Time-to-fill is visible and measurable, so it gets managed. Hiring quality is delayed and diffuse, so it gets sacrificed. This is precisely backwards. A bad hire costs you 10-15x more than vacancy costs.
Second, hiring is capital allocation.
You wouldn't approve a $300,000 capital expenditure with 40% failure rate and no analytical framework. Yet that's what you do every time you hire without rigorous process. Treat hiring decisions with the same analytical discipline you apply to equipment purchases or facility leases.
Third, your hiring budget is fiction.
You budget for recruiting costs, but the real expense is failure cost. If you're hiring 20 people per year at $75,000 average salary, and your failure rate is 40%, you're not spending $500,000 on recruiting. You're spending $500,000 on recruiting plus $2,274,800 on hiring failures (8 failures × $284,350). That's a $2.8 million budget line that doesn't appear in your budget.
The Path Forward
Start measuring differently. Track these metrics:
18-month retention rate (percentage of hires still performing well after 18 months)
Time to productivity (months until new hire reaches 85% of expected output)
Hiring manager satisfaction (6-month and 18-month retrospective ratings)
Cost per quality hire (total recruiting cost divided by successful hires, not total hires)
Then run the ROI calculations. If your current process costs $25,000 per hire with a 60% success rate, your cost per quality hire is $41,667. If a more rigorous process costs $32,000 per hire but delivers 80% success rate, your cost per quality hire drops to $40,000.
The slower, more expensive process is actually cheaper.
This isn't an argument for perfection. It's an argument for precision. Know what hiring actually costs, measure what actually matters, and optimize for the right variables. The accounting will follow.
Your next bad hire will cost you $300,000. The question is whether you'll know it.
This is the first article in The Hiring Economics Series, which examines the economic frameworks and incentives that drive hiring decisions. Next: "The ATS Arms Race: How Your Screening Process Filters Out Top Talent."